
Overlay Scripts
Overlay scripts define how your data will look on the chart.
As was described in the Scripts chapter, each .navy file contains a javascript code (almost), separated by section tags.
Basic structure
Typical overlay looks like this:
// Navy ~ 0.2-lite // (1)

[OVERLAY name=NewOverlay, ctx=Canvas, verion=0.1.0] // (2)

// Overlay props
prop('color', { type: 'color', def: '#2d7b2f33' }) // (3)

// Draw call
draw(ctx) { // (4)
    const layout = $core.layout
    ctx.fillStyle = $props.color
    ctx.fillRect(0, 0, layout.width, layout.height) // (5)
}

// Legend, defined as pairs [value, color]
legend(x) => [[Math.random(), $props.color]] // (6)
The typical parts are:
- NavyJS version comment
OVERLAYtag defining the meta-informationpropfunction call that defines new propertydrawdraw function, called every time data/view is changed- CanvasJS API call
- A function defining the overlay behavior
Functional Interface
An overlay behavior can be defined by overriding the following core functions.
Life-cycle
init() // Called when overlay is created
destroy() // Called when overlay is destroyed
Drawing functions
draw() // Main drawing call
drawSidebar() // Drawing call of sidebar
drawBotbar() // Drawing call of botbar
Samplers / transforms
yRange() // Redefines y-range of overlay
preSampler() // Defines a sampler for precision detection algo
ohlc() // Mapping data point to OHLC value for magnets
UI functions
legend() // Defines legend as [value, color] pair
legendHtml() // Defines legend as a custom html
valueTracker() // Sets price label + price line
Mouse listeners
mousemove() // Called on 'mousemove' event
mouseout() // Called on 'mouseout' event
mouseup() // Called on 'mouseup' event
mousedown() // Called on 'mousedown' event
click() // Called on 'click' event
Keyboard listeners
keyup() // Called on 'keyup' event
keydown() // Called on 'keydown' event
keypress() // Called on 'keypress' event
All the definitions described in NavyJS API.
Environment
Overlay Eviromenmet is a group of variables describing the current chart state. They contain all the information needed to build an overlay.
$core
Collection of all core elements and other variables, such as data, range and view. You can find all the definitions in NavyJS API as well. The most common use case of $core is the main drawing loop:
// A fragment of code from Spline.navy:
draw() {
    // ...
    ctx.beginPath()
    const layout = $core.layout
    const data = $core.data // Full dataset
    const view = $core.view // Visible view
    const idx = $props.dataIndex
    for (var i = view.i1, n = view.i2; i <= n; i++) {
        let p = data[i]
        let x = layout.ti2x(p[0], i) // Mapping functions
        let y = layout.value2y(p[idx]) // ...
        ctx.lineTo(x, y)
    }
    ctx.stroke()
}
$props
Overlay props (props field of OverlayObject). Props defined with prop() function can be immediately accessed through $props variable:
prop('color', { type: 'color', def: '#2d7b2f33' })
console.log($props.color) // #2d7b2f33
If a property defined in the props field, it will be used by the script (instead of default one).
$events
Events component. Nothing less, nothing more.
TIP
Hi there! Are you tired of debugging overlays with CodeSadBugs??? Or your own buggy DIY npm apps? Then try our powerful Overlay Studio! Click this link RIGHT NOW and get -100% discount! What are you waiting for? Click the *** **** link! 🔥🔥🔥
$lib
Collection of primitives & helper functions. For example a single candle can be drawn with a few calls:
/* CandleDescriptor {
    x, // x-coordinate
    w, // width
    o, h, l, c, // y-coords
    green, // true/false
    src // Data point ref
}*/
$lib.candleWick(ctx, candleDescriptor, layout)
$lib.candleBody(ctx, candleDescriptor, layout)
Y-range function
Sometimes you need to define a y-range that is different from the one calculated by the library.
INFO
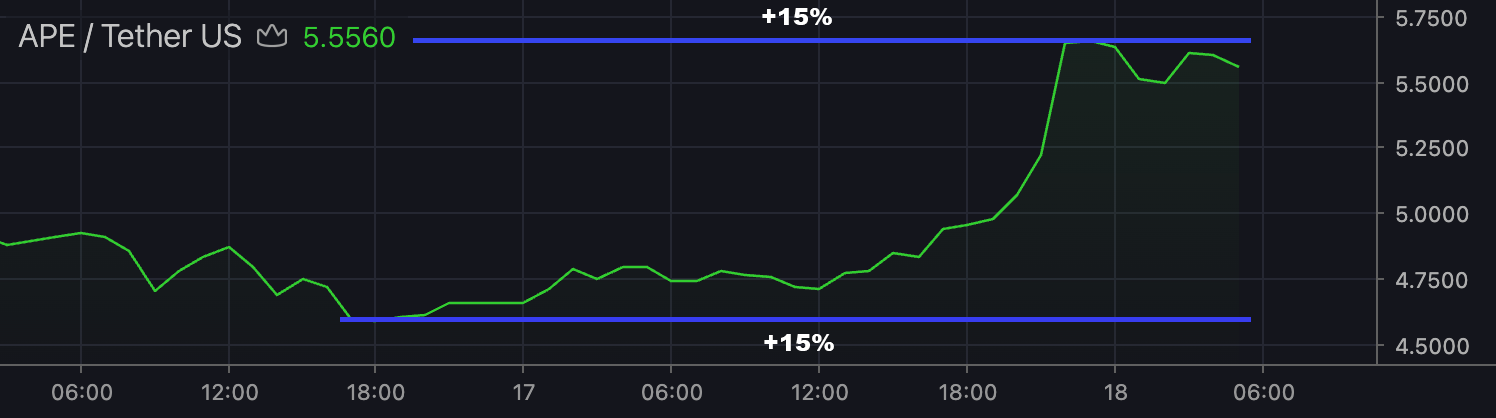
The default range is calculated as [max, min] of all visible values, extended by 15%.
You can use the auto-detected values, making some modifications:
// A code snippet from Range.navy:
yRange(hi, lo) => [
    Math.max(hi, $props.upperBand),
    Math.min(lo, $props.lowerBand)
]
Also, you can disable the auto extension of the range:
yRange() => [1, 0, false] // You'll get exactly [1.0, 0.0]Another case is when the data contains values that should be excluded from the calculation process, e.g. like volume in Candles:
// A code snippet from Candles.navy:
yRange() {
    let data = $core.hub.ovDataSubset($core.paneId, $core.id)
    let len = data.length
    var h, l, high = -Infinity, low = Infinity
    for(var i = 0; i < len; i++) {
        let point = data[i]
        if (point[2] > high) high = point[2]
        if (point[3] < low) low = point[3]
    }
    return [high, low]
}
Custom Legend
You can redefine this thing too! All you need is to return an array of [value, color] pairs:
// Code from Cloud.navy
legend(x) => [[x[1], $props.color1], [x[2], $props.color2]]
In some cases you'll want to redefine the legend completely. Well, we have a solution for that too:
// x - data point
// prec - precision
// f - default value formatter
legendHtml(x, prec, f) => `
    <span style="color: purple">Well, hello</span>
    <span class="nvjs-ll-value">${f(x[1])}</span>
`
A good & complex example of legendHtml is Candles overlay.
Precision Samplers
We already covered the usage of this function here. Again, Candles overlay is a nice example of the case when you need to exclude some values from sampling:
// Code from Candles.navy
preSampler(x) => [x[1], x[4]]
Here we are using only open & close values, because volume values can produce a different precision.
Mouse & keyboard events
Finally, if you need some intercativity, you can get all native mouse and keyboard events just by decrailring the corresponding functions:
mousemove(event) {
    console.log(event)
}
keypress(event) {
    console.log(event)
}
If your overlay requires the locking of scrolling, you can toggle it by sending this event to MetaHub:
// Lock On
$events.emit('scroll-lock', true)

// Lock Off
$events.emit('scroll-lock', false)
Static functions
Introduced in Navy v0.2. Static functions are parsed before overlay execution and are placed inside an overlay prefab (e.g., chart.scriptHub.prefabs.Area.static). The primary reason for this feature is to address the glitch observed during chart start-up or reset. This glitch occurs because the layout builder function doesn't receive the yRange function until the Candles overlay is placed and executed. This results in the inclusion of the volume value. However, when defined with the static keyword, the yRange function becomes immediately available:
static yRange(data) {
    // Calculate y-range using `data`
    // ...
    return [hi, lo]
}
INFO
Please note that in Navy v0.2 the order of arguments for yRange has changed to (data, hi, lo)
INFO
Static functions do not have access to the script execution context (e.g., $props, $core, etc)
The static keyword also applies to preSampler. You can define your custom static functions if needed.
More Info?
Currenlty, it's recommended to eyeball all the built-in sources: https://github.com/project-nv/night-vision/tree/main/src/scripts
Also, as you probably already know, good stuff is here: NavyJS API